

The Basics: Biological Age
Understand how your body is really aging, and what you can do about it.

Your Biological Age: What It Is, Why It Matters, and How to Improve It
Your birthday tells you how many years you've been alive. Your biological age tells you how well you've been living them.
While chronological age is fixed, biological age is dynamic - shaped by your sleep, movement, fitness, nutrition, and blood chemistry. It's one of the most honest signals your body can give you about your long-term health trajectory.
Chronological vs. Biological Age: What's the Difference?
Two people can both be 42 years old and be aging at very different rates. One might have the physiological profile of a 35-year-old; the other, a 50-year-old. Same birthday, very different biology.
That gap is what Biological Age is designed to capture. It doesn't compare you to the average person your age; it compares you to an optimal health profile for your demographic. If your Biological Age is lower than your chronological age, your body is aging more slowly than that benchmark. If it's higher, there's meaningful room to improve.
What Goes Into Your Biological Age?
Bevel calculates Biological Age from three groups of factors, updated every Monday.
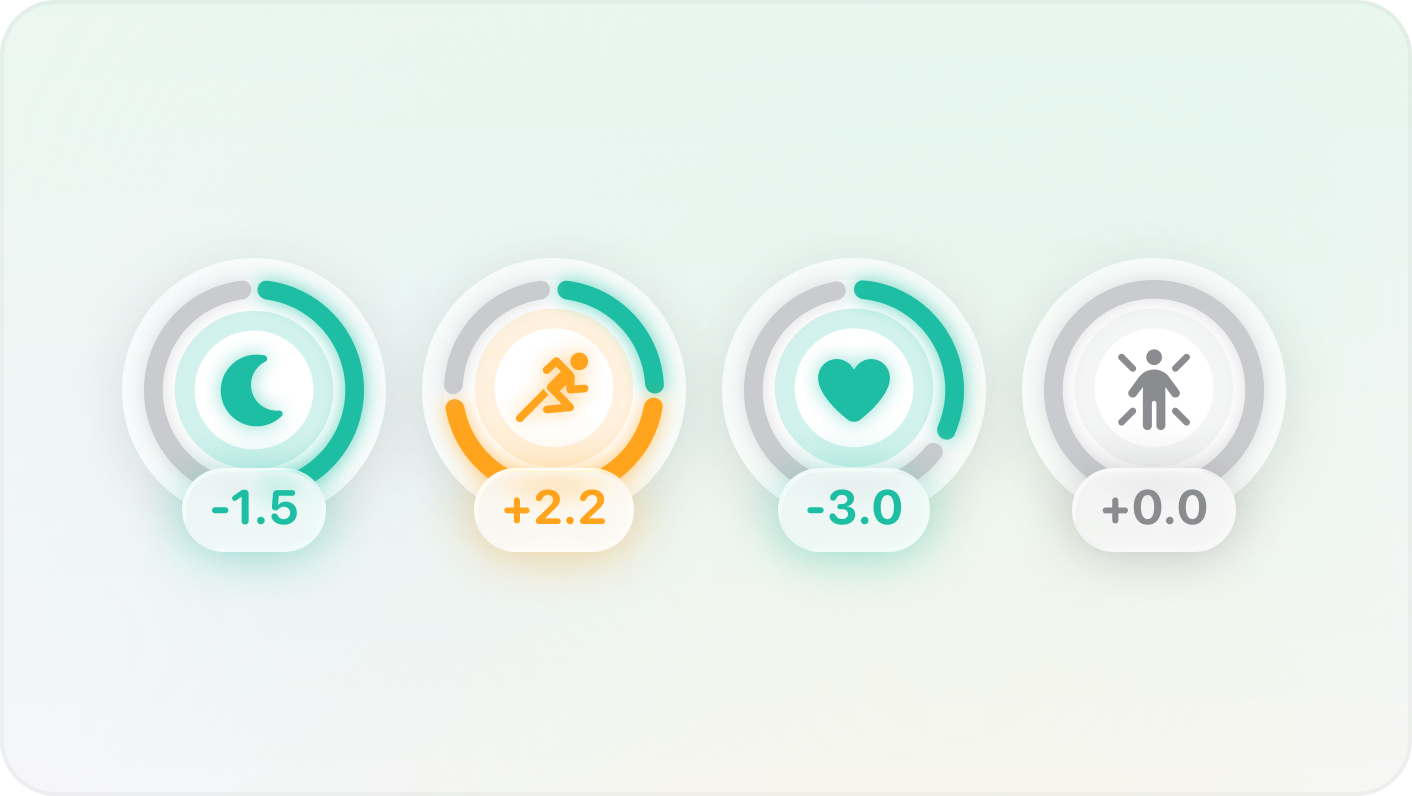
Physiological & Lifestyle Factors
These reflect your day-to-day habits, averaged across the past four weeks:
- Sleep — Time Asleep and Sleep Consistency
- Activity — Daily steps, time in Heart Rate Zones 2–3 (aerobic base), Zones 4–5 (high intensity), and Strength Training
- Fitness — VO₂ Max, Resting Heart Rate, and Lean Body Mass
- Lifestyle — Nutrition Score, Alcohol intake, and Smoking impact (tracked via in-app surveys on frequency, duration, and strength)
Think of these as the inputs — the levers you pull every day.

Blood Biomarkers
These reflect how your habits are actually showing up at a cellular and metabolic level. Bevel uses nine routine biomarkers from Levine's validated PhenoAge model (Levine et al., 2018). These are the nine markers and what they reflect:
- Albumin — Nutritional status and liver function
- Creatinine — Kidney function
- Glucose — Blood sugar and metabolic health
- hs-CRP — Systemic inflammation
- Lymphocytes — Immune function
- MCV — Red blood cell size (nutrient and oxygen delivery)
- RDW — Red blood cell variability (a marker of cellular aging)
- ALP — Liver and bone health
- WBC Count — Overall immune activity
Think of these as the outputs — the biological fingerprint your lifestyle leaves behind. To include them in your Biological Age, upload your blood test results directly in the Biology tab by tapping ··· > Upload Blood Test.
You can also monitor 100+ additional biomarkers in Bevel's Biology section, including ApoB, HbA1c, Fasting Insulin, Ferritin, Lipoprotein(a), and Omega-3 Index, all of which have been linked to chronic disease risk and longevity.
How the Calculation Works
Each factor is mapped against evidence-based benchmarks for healthy aging, with thresholds adjusted for your age and sex. Published hazard ratios are then used to estimate how each factor shifts your long-term health risk relative to those benchmarks, and the combined result is your Biological Age.
In plain terms: the model asks, "Given these markers, how is this person's body likely to age?" and translates that into a single, trackable number.
Understanding "Confidence" and how Biological Age is weighted

What "Confidence" Means
Confidence reflects how complete and current your data is. For physiological factors, high confidence means at least 20 days of data in the past month. For blood biomarkers, it means results less than six months old with all nine markers present.
Higher-confidence factors carry more weight in your score. A blood panel from 14 months ago will hold far less sway than your last four weeks of sleep, steps, and VO₂ Max, because your physiology can change meaningfully in that window. This also means your Biological Age can shift before you've updated your bloodwork.
Why Your Age Biomarker Scores Don't Sum Perfectly
If you have a mix of physiological, lifestyle, and blood biomarkers available, you may notice that the year-impact estimates across your individual factors don't add up neatly to your total Biological Age delta. This is intentional.
Many factors in the model overlap; they're measuring related aspects of the same underlying biology. Resting Heart Rate and VO₂ Max both reflect cardiovascular fitness. Glucose and Nutrition Score are biologically linked. Lean Body Mass and Strength Training are cause and effect. If the model treated each independently, it would double-count these relationships and overstate the total impact. Instead, Bevel accounts for this covariance, so the combined effect is appropriately moderated.
The individual contributions won't sum to a clean total, but the overall estimate is more accurate because of it.
How to Actually Use It
Biological Age is most powerful as a prioritization tool. Rather than trying to optimize everything at once, use it to identify your two or three highest-impact opportunities and focus there.
A few examples of what that can look like in practice:
- A resting heart rate of 78 bpm, combined with low weekly Zone 2 time, points toward a clear opportunity: gradually increasing aerobic training volume. Over weeks and months, this can lower RHR and improve VO₂ Max, both of which move the needle meaningfully on Biological Age.
- An elevated hs-CRP (a marker of inflammation) alongside poor Nutrition Score suggests that dietary changes (like reducing ultra-processed foods, increasing fiber and omega-3s) could produce measurable biological improvement within months.
- Low Lean Body Mass relative to your demographic, especially combined with minimal strength training, signals that resistance training may be your highest-leverage move right now. Even two sessions per week has documented effects on metabolic health and body composition over time.
Small changes, applied consistently, compound. That's the core premise behind tracking Biological Age: not to give you a score to be anxious about, but to give you a feedback loop that makes progress visible.
For a deeper view, tap the change from last week indicator under your Biological Age. From there, you can see your Biological Age history over time, a projection of where you're headed over the next 20 years, and your top positive and negative contributors; the factors helping your score the most, and the ones holding it back.
Disclaimer
Biological Age is an educational tool grounded in population-level research, not a medical diagnosis. Wearables, surveys, and blood panels are powerful, but they don't capture everything. Genetics, stress, medication, and many other factors also influence how you age.
Always consult a qualified healthcare professional before making significant changes to your exercise, nutrition, or health behaviors, especially if you have existing health conditions.
Read more about the limitations of Biological Age here.
Related articles


